Lincang
Prefecture-level city in Yunnan, People's Republic of China
Lincang 临沧市 | |
|---|---|
Prefecture-level city | |
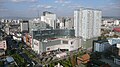
 View of a cultivated area from a road in Lincang | |
 Location of Lincang City jurisdiction in Yunnan | |
| 23°53′02″N 100°05′20″E / 23.884°N 100.089°E / 23.884; 100.089 | |
| Country | People's Republic of China |
| Province | Yunnan |
| Admin HQ | Linxiang |
| Area | |
| • Total | 23,620.72 km2 (9,120.01 sq mi) |
| Elevation | 1,517 m (4,977 ft) |
| Population (2010) | |
| • Total | 2,429,505 |
| • Density | 100/km2 (270/sq mi) |
| GDP[1] | |
| • Total | CN¥ 100 billion US$ 14.8 billion |
| • Per capita | CN¥ 44,723 US$ 6,596 |
| Time zone | UTC+8 (China Standard) |
| Postal code | 677XXX |
| Area code | 0883 |
| ISO 3166 code | CN-YN-09 |
| Licence plate prefixes | 云S |
| Website | www |
Lincang (simplified Chinese: 临沧; traditional Chinese: 臨滄; pinyin: Líncāng) is a prefecture-level city located in the southwest of Yunnan province, People's Republic of China.
History
Lincang was previously called Baihuai during the Shang dynasty.
On December 26, 2003, the state council approved the cancellation of Lincang District and set up prefecture-level Lincang city.
Geography and climate

Lincang covers latitude 23° 05′-25° 02′ N and longitude 98° 40′-100° 33′ E, thus straddling the Tropic of Cancer in the southern part of its administrative area, or prefecture. It is situated on the middle to lower reaches of the Mekong, known as the Lancang in China, and the Salween, or the Nu. Bordering prefectures are Pu'er to the southeast, and Baoshan and Dali to the northwest. It also borders Burma's Shan State. Elevations within the prefecture range from 450 to 3,504 metres (1,476 to 11,496 ft).
Located at an altitude of above 1,450 m (4,760 ft) and within 30 arc minutes to the north of the Tropic of Cancer, Lincang has a mild subtropical highland climate (Köppen Cwb), bordering on a humid subtropical climate (Köppen Cwa), with muddled distinction between the seasons and daytime temperatures remaining warm year-round. Highs peak in May before the core of the rainy season and reach a minimum in December; however, the warmest and coolest months are June and January respectively. June through September accounts for nearly 70% of the annual rainfall of 1,126 mm (44.3 in) and during this time, some rainfall occurs on most days, pushing relative humidity above 80% and there is a marked reduction in sunshine. With monthly percent possible sunshine ranging from 24% in July to 75% in January, the city receives 2,227 hours of bright sunshine annually.
| Climate data for Lincang (1991–2019 normals, extremes 1971–2010) | |||||||||||||
|---|---|---|---|---|---|---|---|---|---|---|---|---|---|
| Month | Jan | Feb | Mar | Apr | May | Jun | Jul | Aug | Sep | Oct | Nov | Dec | Year |
| Record high °C (°F) | 25.9 (78.6) | 28.6 (83.5) | 30.5 (86.9) | 32.4 (90.3) | 34.2 (93.6) | 34.4 (93.9) | 32.7 (90.9) | 31.7 (89.1) | 30.9 (87.6) | 29.6 (85.3) | 27.2 (81.0) | 25.8 (78.4) | 34.4 (93.9) |
| Mean daily maximum °C (°F) | 20.6 (69.1) | 22.6 (72.7) | 25.4 (77.7) | 27.2 (81.0) | 27.4 (81.3) | 27.0 (80.6) | 26.3 (79.3) | 26.9 (80.4) | 26.3 (79.3) | 24.7 (76.5) | 22.6 (72.7) | 20.4 (68.7) | 24.8 (76.6) |
| Daily mean °C (°F) | 11.8 (53.2) | 14.1 (57.4) | 17.2 (63.0) | 19.6 (67.3) | 21.2 (70.2) | 22.2 (72.0) | 21.9 (71.4) | 21.9 (71.4) | 21.0 (69.8) | 18.9 (66.0) | 15.1 (59.2) | 12.1 (53.8) | 18.1 (64.6) |
| Mean daily minimum °C (°F) | 5.5 (41.9) | 7.4 (45.3) | 10.6 (51.1) | 13.4 (56.1) | 16.5 (61.7) | 19.1 (66.4) | 19.4 (66.9) | 19.0 (66.2) | 17.9 (64.2) | 15.3 (59.5) | 10.3 (50.5) | 6.6 (43.9) | 13.4 (56.1) |
| Record low °C (°F) | −1.3 (29.7) | 1.5 (34.7) | 0.9 (33.6) | 6.9 (44.4) | 10.2 (50.4) | 13.4 (56.1) | 14.6 (58.3) | 13.7 (56.7) | 10.9 (51.6) | 6.7 (44.1) | 1.8 (35.2) | −1.0 (30.2) | −1.3 (29.7) |
| Average precipitation mm (inches) | 22.4 (0.88) | 14.3 (0.56) | 20.5 (0.81) | 42.6 (1.68) | 100.9 (3.97) | 155.7 (6.13) | 255.6 (10.06) | 215.1 (8.47) | 141.7 (5.58) | 108.2 (4.26) | 37.3 (1.47) | 11.4 (0.45) | 1,125.7 (44.32) |
| Average precipitation days (≥ 0.1 mm) | 3.4 | 3.7 | 5.3 | 9.5 | 15.9 | 21.7 | 25.9 | 23.2 | 19.2 | 15.0 | 6.0 | 3.6 | 152.4 |
| Average relative humidity (%) | 63 | 56 | 52 | 57 | 67 | 78 | 82 | 81 | 79 | 78 | 73 | 70 | 70 |
| Mean monthly sunshine hours | 250.5 | 233.2 | 241.7 | 223.3 | 189.6 | 126.3 | 100.5 | 132.0 | 132.7 | 155.4 | 209.6 | 232.3 | 2,227.1 |
| Percent possible sunshine | 75 | 72 | 65 | 58 | 46 | 31 | 24 | 33 | 36 | 44 | 64 | 70 | 52 |
| Source 1: China Meteorological Administration[2][3][4] | |||||||||||||
| Source 2: Weather China[5] | |||||||||||||
Subdivisions
| Map | |||||
|---|---|---|---|---|---|
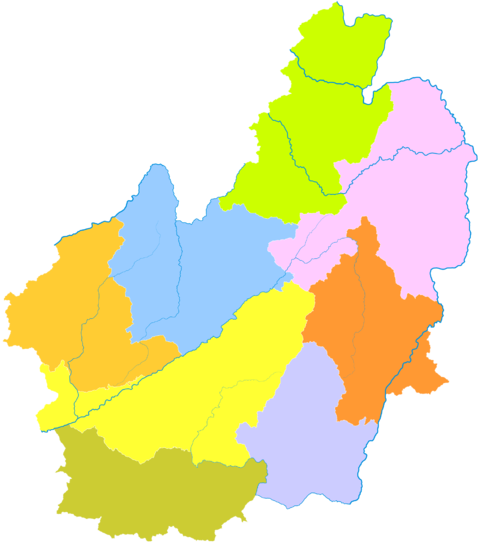 Linxiang Fengqing County Yun County Yongde County Zhenkang County Cangyuan County Shuangjiang County Gengma County | |||||
| Name | Hanzi | Hanyu Pinyin | Population (2010) | Area (km2) | Density (/km2) |
| Linxiang District | 临翔区 | Línxiáng Qū | 323,708 | 2,652 | 122 |
| Fengqing County | 凤庆县 | Fèngqìng Xiàn | 458,330 | 3,451 | 133 |
| Yun County | 云县 | Yún Xiàn | 449,460 | 3,760 | 120 |
| Yongde County | 永德县 | Yǒngdé Xiàn | 369,702 | 3,296 | 112 |
| Zhenkang County | 镇康县 | Zhènkāng Xiàn | 176,356 | 2,642 | 67 |
| Shuangjiang Lahu, Va, Blang and Dai Autonomous County | 双江拉祜族佤族布朗族傣族自治县 | Shuāngjiāng Lāhùzú Wǎzú Bùlǎngzú Dǎizú Zìzhìxiàn | 176,549 | 2,292 | 77 |
| Gengma Dai and Va Autonomous County | 耿马傣族佤族自治县 | Gěngmǎ Dǎizú Wǎzú Zìzhìxiàn | 296,302 | 3,837 | 77 |
| Cangyuan Va Autonomous County | 沧源佤族自治县 | Cāngyuán Wǎzú Zìzhìxiàn | 179,098 | 2,539 | 71 |
Demography
Among the resident population, the Han population is 1,523,670, accounting for 62.72% of the total population; the ethnic minorities population is 905,835, accounting for 37.28% of the total population.
| National name | Han | Yi | Wa | Dai | Lahu | Bulang | Bai | Hui | Lisu | Miao | Others |
|---|---|---|---|---|---|---|---|---|---|---|---|
| Population | 1523662 | 355768 | 235165 | 114312 | 85818 | 40434 | 30904 | 10081 | 9237 | 8856 | 15260 |
| Proportion of total population (%) | 62.72 | 14.64 | 9.68 | 4.71 | 3.53 | 1.66 | 1.27 | 0.41 | 0.38 | 0.36 | 0.63 |
| Proportion of minority population (%) | --- | 39.28 | 25.96 | 12.62 | 9.47 | 4.46 | 3.41 | 1.11 | 1.02 | 0.98 | 1.68 |
Natural resources
Mineral resources mined and extracted in the Lincang area include coal (including waste coal ash), germanium and uranium.[7] Lincang is also home to the world's oldest cultivated tea tree, especially pu'er tea, some 3,200 years old, in the village of Jinxiu (锦绣), Xiaowan town, of Fengqing County.[8][9]
Transport
References
- ^ 云南省统计局、国家统计局云南调查总队 (December 2023). 《云南统计年鉴-2023》. 中国统计出版社. ISBN 978-7-5037-9653-1.
- ^ 中国气象数据网 – WeatherBk Data (in Simplified Chinese). China Meteorological Administration. Retrieved 20 September 2023.
- ^ "Experience Template" 中国气象数据网 (in Simplified Chinese). China Meteorological Administration. Retrieved 20 September 2023.
- ^ 中国地面国际交换站气候标准值月值数据集(1971-2000年). China Meteorological Administration. Archived from the original on 2013-09-21. Retrieved 2010-05-25.
- ^ 临沧 - 气象数据 -中国天气网 (in Chinese). Weather China. Retrieved 26 November 2022.
- ^ Yunnan Provincial Census Office, Yunnan Provincial Bureau of Statistics (September 2012). "Yunnan Provincial Census Data in 2010". China Statistics Press. ISBN 978-7-5037-6548-3.
- ^ Sparton Resources Inc.
- ^ The Oldest Tea Tree on the Earth, (Kunming, 2006).
- ^ News article about oldest tea tree
External links
- Lincang City Official Website
Yunnan topics | |
| General | |
| Geography | |
| Education | |
| Culture | |
| Cuisine |
|
| Visitor attractions | |
| |


Largest cities in Yunnan Source: China Urban Construction Statistical Yearbook 2018 Urban Population and Urban Temporary Population | |||||||||||||||||||||||||||||||||||||||||||||||||||||||||||||||||||||||
|---|---|---|---|---|---|---|---|---|---|---|---|---|---|---|---|---|---|---|---|---|---|---|---|---|---|---|---|---|---|---|---|---|---|---|---|---|---|---|---|---|---|---|---|---|---|---|---|---|---|---|---|---|---|---|---|---|---|---|---|---|---|---|---|---|---|---|---|---|---|---|---|
| |||||||||||||||||||||||||||||||||||||||||||||||||||||||||||||||||||||||