Timeline of the 2017 Atlantic hurricane season
| Timeline of the 2017 Atlantic hurricane season | |||||||
|---|---|---|---|---|---|---|---|
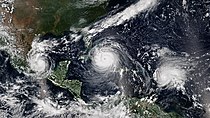
 Season summary map | |||||||
| Season boundaries | |||||||
| First system formed | April 19, 2017 | ||||||
| Last system dissipated | November 9, 2017 | ||||||
| Strongest system | |||||||
| By maximum sustained winds | Irma | ||||||
| Maximum winds | 180 mph (285 km/h) (1-minute sustained) | ||||||
| Lowest pressure | 914 mbar (hPa; 26.99 inHg) | ||||||
| By central pressure | Maria | ||||||
| Maximum winds | 175 mph (280 km/h) (1-minute sustained) | ||||||
| Lowest pressure | 908 mbar (hPa; 26.81 inHg) | ||||||
| Longest lasting system | |||||||
| Name | Jose | ||||||
| Duration | 17.25 days | ||||||
| |||||||
| Other years 2015, 2016, 2017, 2018, 2019 | |||||||
The 2017 Atlantic hurricane season was an event in the annual tropical cyclone season in the north Atlantic Ocean. This Atlantic hurricane season saw above-normal activity;[nb 1] it was the seventh most active season on record and the most active since 2005.[2] The season officially began on June 1, 2017 and ended on November 30, 2017. These dates, adopted by convention, historically describe the period in each year when most tropical systems form.[3] However, storm formation is possible at any time of the year, as demonstrated in 2017 by the formation of the season's first named storm, Tropical Storm Arlene, on April 19. The final storm of the season, Tropical Storm Rina degenerated to a remnant area of low pressure on November 9.
The 2017 season produced 17 named storms, of which 10 became hurricanes including six of which intensified into major hurricanes (Category 3, 4 or 5). Of those six, Harvey and Irma, became the first major hurricanes to make landfall on the continental United States in 12 years;[2] a third hurricane, Nate, did so as well. September was both the most active month in the season and the most active month for Atlantic hurricanes ever recorded. Four long-lived major hurricanes—Irma, Jose, Lee and Maria—moved through the Atlantic Basin, as did the short-lived Hurricane Katia. Overall, more accumulated cyclone energy was generated during September 2017 than during the entire 2016 season.[4] In April 2018, the World Meteorological Organization retired the names Harvey, Irma, Maria, and Nate from its rotating naming lists due to the number of deaths and amount of damage they caused, and they will not be used again for another Atlantic hurricane.[5]
This timeline documents tropical cyclone formations, strengthening, weakening, landfalls, extratropical transitions, and dissipations during the season. It includes information that was not released throughout the season, meaning that data from post-storm reviews by the National Hurricane Center, such as a storm that was not initially warned upon, has been included.
By convention, meteorologists use one time zone when issuing forecasts and making observations: Coordinated Universal Time (UTC), and also use the 24-hour clock (where 00:00 = midnight UTC).[6] The National Hurricane Center uses both UTC and the time zone where the center of the tropical cyclone is currently located. The time zones utilized (east to west) prior to 2020 were: Atlantic, Eastern, and Central.[7] In this timeline, all information is listed by UTC first with the respective regional time included in parentheses. Additionally, figures for maximum sustained winds and position estimates are rounded to the nearest 5 units (knots, miles, or kilometers), following the convention used in the National Hurricane Center's products. Direct wind observations are rounded to the nearest whole number. Atmospheric pressures are listed to the nearest millibar and nearest hundredth of an inch of mercury.
Timeline

April
April 19
- 00:00 UTC (8:00 p.m. AST, April 18) at 31°06′N 42°36′W / 31.1°N 42.6°W / 31.1; -42.6 (Subtropical Depression One develops) – Subtropical Depression One develops from an area of low pressure about 980 mi (1,575 km) southwest of the Azores.[8]

April 20
- 00:00 UTC (8:00 p.m. AST April 19) at 32°48′N 39°36′W / 32.8°N 39.6°W / 32.8; -39.6 (Subtropical Depression One transitions into Tropical Depression One) – Subtropical Depression One transitions into Tropical Depression One roughly 775 mi (1,250 km) southwest of the Azores.[8]
- 06:00 UTC (2:00 a.m. AST) at 33°48′N 39°12′W / 33.8°N 39.2°W / 33.8; -39.2 (Subtropical Depression One intensifies into Tropical Storm Arlene) – Tropical Depression One intensifies into Tropical Storm Arlene approximately 720 mi (1,160 km) southwest of the Azores.[8]
April 21
- 00:00 UTC (8:00 p.m. AST April 20) at 39°00′N 43°00′W / 39.0°N 43.0°W / 39.0; -43.0 (Tropical Storm Arlene attains peak winds of 50 mph (80 km/h)) – Tropical Storm Arlene attains its peak intensity with maximum sustained winds of 50 mph (85 km/h) and a minimum barometric pressure of 990 mbar (990 hPa; 29 inHg), about 805 mi (1,295 km) west of the Azores.[8]
- 12:00 UTC (8:00 a.m. AST) at 39°54′N 49°18′W / 39.9°N 49.3°W / 39.9; -49.3 (Tropical Storm Arlene transitions into a post-tropical cyclone) – Tropical Storm Arlene transitions into an extratropical cyclone roughly 1,135 mi (1,825 km) west of the Azores, and subsequently dissipates.[8]
May
- No tropical cyclones form in the Atlantic Ocean during the month of May.
June
June 1
- The 2017 Atlantic hurricane season officially begins.[3]
June 19
- 18:00 UTC (2:00 p.m. AST) at 9°12′N 58°54′W / 9.2°N 58.9°W / 9.2; -58.9 (Tropical Storm Bret organizes) – Tropical Storm Bret forms from a tropical wave about 185 mi (298 km) east-southeast of Trinidad, with a minimum barometric pressure of 1,007 mbar (1,007 hPa; 29.7 inHg).[nb 2][10]
June 20
- 02:00 UTC (10:00 p.m. AST) at 10°06′N 61°06′W / 10.1°N 61.1°W / 10.1; -61.1 (Tropical Storm makes landfall on Trinidad) – Tropical Storm Bret attains peak winds of 50 mph (80 km/h) and makes landfall in southwestern Trinidad.[10]
- 09:00 UTC (5:00 a.m. AST) at 10°36′N 62°36′W / 10.6°N 62.6°W / 10.6; -62.6 (Tropical Storm Bret makes landfall on the Paria Peninsula) – Tropical Storm Bret makes landfall on the Paria Peninsula of Venezuela, with winds of 50 mph (80 km/h), and rapidly degenerates into a remnant low, which later dissipates.[nb 3][10]
- 18:00 UTC (1:00 p.m. CDT) at 25°36′N 90°36′W / 25.6°N 90.6°W / 25.6; -90.6 (Tropical Storm Cindy forms) – Tropical Storm Cindy forms from a tropical wave about 240 mi (390 km) south-southwest of the mouth of the Mississippi River.[nb 4][13]
June 21
- 00:00 UTC (7:00 p.m. CDT, June 20) at 26°12′N 90°54′W / 26.2°N 90.9°W / 26.2; -90.9 (Tropical Storm Cindy attains peak wind speed) – Tropical Storm Cindy attains peak sustained winds of 60 mph (97 km/h), about 290 mi (465 km) southeast of Cameron, Louisiana.[13]
June 22
- 06:00 UTC (1:00 a.m. CDT) at 29°24′N 93°36′W / 29.4°N 93.6°W / 29.4; -93.6 (Tropical Storm Cindy attains minimum barometric pressure) – Tropical Storm Cindy attains a minimum barometric pressure of 991 mbar (991 hPa; 29.3 inHg), about 35 mi (55 km) west-southwest of Cameron.[13]
- 07:00 UTC (2:00 a.m. CDT) at 29°48′N 93°42′W / 29.8°N 93.7°W / 29.8; -93.7 (Tropical Storm Cindy makes landfall) – Tropical Storm Cindy makes landfall about 25 mi (35 km) west of Cameron, just east of the Sabine Pass, with sustained winds of 50 mph (80 km/h).[13]
June 23
- 00:00 UTC (7:00 p.m. CDT, June 22) at 32°48′N 93°36′W / 32.8°N 93.6°W / 32.8; -93.6 (Tropical Storm Cindy weakens to a tropical depression) – Tropical Storm Cindy weakens to a tropical depression about 30 mi (45 km) north-northeast of Shreveport, Louisiana.[13]
- 18:00 UTC (1:00 p.m. CDT) at 36°42′N 88°06′W / 36.7°N 88.1°W / 36.7; -88.1 (Tropical Depression Cindy degenerates to a remnant low) – Tropical Depression Cindy degenerates to a remnant low about 35 mi (56 km) west of Hopkinsville, Kentucky, and subsequently dissipates.[13]
July
July 5
- 18:00 UTC (2:00 p.m. AST) at 12°00′N 37°06′W / 12.0°N 37.1°W / 12.0; -37.1 (Tropical Depression Four develops) – Tropical Depression Four develops from a tropical wave about 1,640 mi (2,640 km) east of the Lesser Antilles.[14]
July 6
- 12:00 UTC (8:00 a.m. AST) at 13°18′N 42°12′W / 13.3°N 42.2°W / 13.3; -42.2 (Tropical Depression Four attains peak intensity) – Tropical Depression Four attains its peak intensity with sustained winds of 30 mph (48 km/h) and a minimum barometric pressure of 1,009 mbar (29.8 inHg), about 1,290 mi (2,075 km) east of the Lesser Antilles.[14]
July 7
- 12:00 UTC (8:00 a.m. AST) at 15°24′N 49°42′W / 15.4°N 49.7°W / 15.4; -49.7 (Tropical Depression Four degenerates) – Tropical Depression Four degenerates into a tropical wave roughly 990 mi (1,595 km) east of the Lesser Antilles, and subsequently dissipates.[14]
July 17
- 06:00 UTC (2:00 a.m. AST) at 10°24′N 49°06′W / 10.4°N 49.1°W / 10.4; -49.1 (Tropical depression number five develops) – A tropical depression develops from a tropical wave about 725 miles (1,167 km) east-southeast of Barbados.[15]
- 12:00 UTC (8:00 a.m. AST) at 10°42′N 50°36′W / 10.7°N 50.6°W / 10.7; -50.6 (Tropical Storm Don forms) – The tropical depression intensifies into Tropical Storm Don about 625 mi (1,010 km) east-southeast of Barbados.[15]
July 18
- 00:00 UTC (8:00 p.m. AST, July 17) at 11°12′N 53°48′W / 11.2°N 53.8°W / 11.2; -53.8 (Tropical Storm Don attains peak intensity) – Tropical Storm Don attains its peak intensity with sustained winds of 50 mph (80 km/h) and a minimum barometric pressure of 1,005 mbar (29.7 inHg), about 415 mi (665 km) east-southeast of Barbados.[15]
- 18:00 UTC (2:00 p.m. AST) at 11°30′N 58°42′W / 11.5°N 58.7°W / 11.5; -58.7 (Tropical Storm Don dissipates) – Tropical Storm Don opens up into a tropical wave about 175 mi (280 km) southeast of Barbados and subsequently dissipates.[15]
July 30
- 18:00 UTC (2:00 p.m. EDT) at 28°24′N 85°24′W / 28.4°N 85.4°W / 28.4; -85.4 (Tropical Depression Six develops) – Tropical Depression Six forms from an area of low pressure about 165 mi (270 km) west-northwest of St. Petersburg, Florida.[16]

July 31
- 00:00 UTC (8:00 p.m. EDT, July 30) at 28°00′N 84°36′W / 28.0°N 84.6°W / 28.0; -84.6 (Tropical Depression Six becomes Tropical Storm Emily) – Tropical Depression Six intensifies to become Tropical Storm Emily about 110 mi (180 km) west of St. Petersburg.[16]
- 14:45 UTC (10:45 a.m. EDT) at 27°30′N 82°42′W / 27.5°N 82.7°W / 27.5; -82.7 (Tropical Storm Emily peaks and makes landfall) – Tropical Storm Emily reaches its peak intensity with sustained winds of 60 mph (95 km/h) and a minimum pressure of 1,001 mbar (29.56 inHg) while simultaneously making landfall about 5 mi (10 km) north of Longboat Key, Florida.[16]
August
August 1
- 00:00 UTC (8:00 p.m. EDT, July 31) at 27°30′N 81°18′W / 27.5°N 81.3°W / 27.5; -81.3 (Tropical Storm Emily weakens to a tropical depression) – Tropical Storm Emily weakens to a tropical depression inland, about 85 mi (140 km) east of Longboat Key.[16]
August 2
- 00:00 UTC (8:00 p.m. EDT, August 1) at 30°42′N 78°06′W / 30.7°N 78.1°W / 30.7; -78.1 (Emily becomes post-tropical) – Tropical Depression Emily degenerates to a post-tropical cyclone over the Atlantic Ocean, roughly 235 mi (378 km) northeast of Cape Canaveral, Florida, and later dissipates.[16][17]
August 7
- 00:00 UTC (8:00 p.m. EDT, August 6) at 16°06′N 82°42′W / 16.1°N 82.7°W / 16.1; -82.7 (Tropical Storm Franklin develops) – Tropical Storm Franklin develops from a tropical wave about 85 mi (140 km) north-northeast of Cabo Gracias a Dios on the Honduras–Nicaragua border.[nb 5][19]
August 8
- 03:45 UTC (10:45 p.m. EDT, August 7) at 19°06′N 87°36′W / 19.1°N 87.6°W / 19.1; -87.6 (Tropical Storm Franklin makes first landfall) – Tropical Storm Franklin makes landfall near Pulticub, Quintana Roo, with winds of 60 mph (97 km/h).[19]

August 9
- 00:00 UTC (7:00 p.m. CDT, August 8) at 20°12′N 90°54′W / 20.2°N 90.9°W / 20.2; -90.9 (Tropical Storm Franklin emerges over the Bay of Campeche) – Tropical Storm Franklin emerges over the Bay of Campeche, 35 mi (55 km) northwest of Campeche City, Campeche.[19]
- 18:00 UTC (1:00 p.m. CDT) at 20°12′N 94°24′W / 20.2°N 94.4°W / 20.2; -94.4 (Tropical Storm Franklin becomes a Category 1 hurricane) – Tropical Storm Franklin intensifies into a Category 1 hurricane, about 135 mi (217 km) east-northeast of Veracruz City, Veracruz.[19]
August 10
- 00:00 UTC (7:00 p.m. CDT, August 9) at 20°18′N 95°30′W / 20.3°N 95.5°W / 20.3; -95.5 (Hurricane Franklin attains peak intensity) – Hurricane Franklin attains its peak intensity with sustained winds of 85 mph (140 km/h) and a minimum pressure of 981 mbar (28.97 inHg), about 90 mi (150 km) north-northeast of Veracruz City.[19]
- 05:00 UTC (12:00 a.m. CDT) at 20°00′N 96°36′W / 20.0°N 96.6°W / 20.0; -96.6 (Hurricane Franklin makes landfall) – Hurricane Franklin makes landfall near Vega de Alatorre, Veracruz, with sustained winds of near 80 mph (130 km/h).[19]
- 06:00 UTC (1:00 a.m. CDT) at 20°00′N 96°48′W / 20.0°N 96.8°W / 20.0; -96.8 (Hurricane Franklin weakens to a tropical storm) – Hurricane Franklin weakens to a tropical storm inland, about 20 mi (30 km) west-southwest of Vega de Alatorre.[19]
- 12:00 UTC (7:00 a.m. CDT) at 19°48′N 98°18′W / 19.8°N 98.3°W / 19.8; -98.3 (Tropical Storm Franklin weakens to a tropical depression) – Tropical Storm Franklin weakens to a tropical depression about 60 miles (97 km) east-northeast of Mexico City, and later dissipates.[nb 6][19][21]
August 12
- 18::00 UTC (2:00 p.m. EDT) at 24°00′N 69°24′W / 24.0°N 69.4°W / 24.0; -69.4 (Tropical Depression Eight forms) – Tropical Depression Eight forms from a tropical wave about 265 mi (425 km) northeast of the Turks and Caicos Islands.[22]
August 13
- 00:00 UTC (8:00 p.m. EDT, August 12) at 24°54′N 70°00′W / 24.9°N 70.0°W / 24.9; -70.0 (Tropical Depression Eight becomes Tropical Storm Gert) – Tropical Depression Eight intensifies into Tropical Storm Gert about 245 mi (400 km) northeast of the southeastern Bahamas.[22]
August 15
- 06:00 UTC (2:00 a.m. EDT) at 31°30′N 72°18′W / 31.5°N 72.3°W / 31.5; -72.3 (Tropical Storm Gert becomes a hurricane) – Tropical Storm Gert intensifies into a Category 1 hurricane, about 435 mi (705 km) west of Bermuda.[22]
August 16
- 12:00 UTC (8:00 a.m. AST) at 38°48′N 67°06′W / 38.8°N 67.1°W / 38.8; -67.1 (Hurricane Gert intensifies to Category 2) – Hurricane Gert intensifies into a Category 2 hurricane, about 465 mi (750 km) west-northwest of Bermuda.[22]
- 18:00 UTC (2:00 p.m. AST) at 38°12′N 64°06′W / 38.2°N 64.1°W / 38.2; -64.1 (Hurricane Gert attains its peak intensity) – Hurricane Gert attains its peak intensity with maximum sustained winds of 110 mph (175 km/h) and a minimum pressure of 962 mbar (28.41 inHg), about 445 mi (715 km) south-southeast of Halifax, Nova Scotia.[22]
August 17
- 06:00 UTC (2:00 a.m. AST) at 40°42′N 56°12′W / 40.7°N 56.2°W / 40.7; -56.2 (Hurricane Gert weakens to Category 1) – Hurricane Gert weakens to Category 1 strength, about 495 mi (795 km) south of St. John's, Newfoundland and Labrador.[22]
- 06:00 UTC (2:00 a.m. AST) at 13°24′N 52°00′W / 13.4°N 52.0°W / 13.4; -52.0 (Tropical depression number nine develops) – The ninth tropical depression of the season develops from a tropical wave about 505 mi (815 km) east of Barbados.[nb 7][24]
- 12:00 UTC (8:00 a.m. AST) at 42°12′N 52°00′W / 42.2°N 52.0°W / 42.2; -52.0 (Hurricane Gert weakens to a tropical storm) – Hurricane Gert weakens to a tropical storm, about 365 mi (585 km) south of St. John's.[22]
- 18:00 UTC (2:00 p.m. AST) at 44°00′N 48°00′W / 44.0°N 48.0°W / 44.0; -48.0 (Tropical Storm Gert becomes extratropical) – Hurricane Gert transitions into an extratropical cyclone, about 335 mi (535 km) southeast of St. John's, and subsequently merges with another extratropical cyclone.[22]
- 18:00 UTC (2:00 p.m. AST) at 13°00′N 55°36′W / 13.0°N 55.6°W / 13.0; -55.6 (Tropical Storm Harvey forms) – The ninth tropical depression intensifies into Tropical Storm Harvey about 270 mi (435 km) east of Barbados.[24]
August 18
- 00:00 UTC (8:00 p.m. AST, August 17) at 13°00′N 56°36′W / 13.0°N 56.6°W / 13.0; -56.6 (Tropical Storm Harvey attains initial peak windspeed) – Tropical Storm Harvey attains its initial peak windspeed of 45 mph (75 km/h), about 200 mi (325 km) east of Barbados.[24]
- 10:00 UTC (6:00 a.m. AST) at 13°06′N 59°36′W / 13.1°N 59.6°W / 13.1; -59.6 (Tropical Storm Harvey makes landfall on Barbados) – Tropical Storm Harvey makes landfall on Barbados, with sustained winds of 45 mph (75 km/h).[24]
- 15:00 UTC (11:00 a.m. AST) at 13°12′N 61°12′W / 13.2°N 61.2°W / 13.2; -61.2 (Tropical Storm Harvey makes landfall on St. Vincent) – Tropical Storm Harvey makes landfall on St. Vincent, with sustained winds of 45 mph (75 km/h).[24]
August 19
- 12:00 UTC (8:00 a.m. AST) at 13°42′N 67°30′W / 13.7°N 67.5°W / 13.7; -67.5 (Tropical Storm Harvey weakens to a tropical depression) – Tropical Storm Harvey weakens to a tropical depression about 425 mi (680 km) west of Saint Vincent.[24]
- 18:00 UTC (2:00 p.m. AST) at 13°48′N 69°12′W / 13.8°N 69.2°W / 13.8; -69.2 (Tropical Depression Harvey degenerates to a tropical wave) – Tropical Depression Harvey degenerates to a tropical wave about 540 mi (865 km) west of St. Vincent.[24]
August 23
- 12:00 UTC (7:00 a.m. CDT) at 21°24′N 92°18′W / 21.4°N 92.3°W / 21.4; -92.3 (Remnants of Harvey regenerate into a tropical depression) – The remnants of Harvey regenerate into a tropical depression in the Bay of Campeche, about 175 mi (280 km) west of Progreso, Yucatán.[24]
- 18:00 UTC (1:00 p.m. CDT) at 21°36′N 92°24′W / 21.6°N 92.4°W / 21.6; -92.4 (Tropical Depression Harvey re-strengthens into a tropical storm) – Tropical Depression Harvey re-strengthens into a tropical storm about 175 mi (280 km) west of Progreso.[24]
August 24
- 18:00 UTC (1:00 p.m. CDT) at 24°24′N 93°36′W / 24.4°N 93.6°W / 24.4; -93.6 (Tropical Storm Harvey intensifies to Category 1) – Tropical Storm Harvey intensifies into a Category 1 hurricane, about 325 mi (523 km) south-southeast of Port O'Connor, Texas.[24][25]
August 25
- 06:00 UTC (1:00 a.m. CDT) at 25°36′N 95°06′W / 25.6°N 95.1°W / 25.6; -95.1 (Hurricane Harvey intensifies to Category 2) – Hurricane Harvey intensifies into a Category 2 hurricane, about 210 mi (340 km) south-southeast of Port O'Connor.[24][26]
- 18:00 UTC (1:00 p.m. CDT) at 27°06′N 96°18′W / 27.1°N 96.3°W / 27.1; -96.3 (Hurricane Harvey intensifies to Category 3) – Hurricane Harvey intensifies into a Category 3 hurricane, about 90 mi (140 km) south of Port O'Connor.[24][27]
August 26
- 00:00 UTC (7:00 p.m. CDT, August 25) at 27°48′N 96°48′W / 27.8°N 96.8°W / 27.8; -96.8 (Hurricane Harvey intensifies to Category 4) – Hurricane Harvey intensifies into a Category 4 hurricane, about 50 mi (80 km) south-southwest of Port O'Connor.[24][28]
- 03:00 UTC (10:00 p.m. CDT, August 25) at 28°00′N 96°54′W / 28.0°N 96.9°W / 28.0; -96.9 (Hurricane Harvey attains its peak intensity and makes landfall) – Hurricane Harvey attains its peak intensity with sustained winds of 130 mph (215 km/h) and a minimum barometric pressure of 937 mbar (27.67 inHg), and simultaneously makes landfall on San Jose Island, Texas.[24]
- 06:00 UTC (1:00 a.m. CDT) at 28°12′N 97°06′W / 28.2°N 97.1°W / 28.2; -97.1 (Hurricane Harvey weakens to Category 3 intensity and makes landfall) – Hurricane Harvey weakens to Category 3 intensity as it makes landfall on the northeast end of Copano Bay, near Holiday Beach, Texas.[24]
- 12:00 UTC (7:00 a.m. CDT) at 28°42′N 97°18′W / 28.7°N 97.3°W / 28.7; -97.3 (Hurricane Harvey weakens to Category 1) – Hurricane Harvey weakens to Category 1 strength inland, about 40 mi (65 km) north-northwest of Holiday Beach.[24]
- 18:00 UTC (1:00 p.m. CDT) at 29°00′N 97°30′W / 29.0°N 97.5°W / 29.0; -97.5 (Hurricane Harvey weakens to a tropical storm) – Hurricane Harvey weakens to tropical storm strength, about 65 mi (100 km) north-northwest of Holiday Beach.[24]
August 29
- 18:00 UTC (1:00 p.m. CDT) at 28°30′N 94°12′W / 28.5°N 94.2°W / 28.5; -94.2 (Tropical Storm Harvey attains secondary peak windspeed) – Tropical Storm Harvey attains a secondary peak windspeed of 50 mph (85 km/h) in the Gulf of Mexico, about 105 mi (170 km) south-southwest of Cameron, Louisiana.[24]
August 30
- 00:00 UTC (8:00 p.m. AST, August 29) at 16°06′N 26°54′W / 16.1°N 26.9°W / 16.1; -26.9 (Tenth tropical depression of the season develops) – The tenth tropical depression of the season develops from a tropical wave, about 140 mi (220 km) west-southwest of São Vicente in the Cabo Verde Islands.[29]
- 06:00 UTC (2:00 a.m. AST) at 16°12′N 28°18′W / 16.2°N 28.3°W / 16.2; -28.3 (Tropical Storm Irma develops) – The tenth tropical depression develops into Tropical Storm Irma, about 225 mi (360 km) west-southwest of São Vicente.[29]
- 08:00 UTC (3:00 a.m. CDT) at 29°48′N 93°30′W / 29.8°N 93.5°W / 29.8; -93.5 (Tropical Storm Harvey makes final landfall) – Tropical Storm Harvey makes its final landfall about 10 mi (20 km) west of Cameron, with sustained winds of 45 mph (75 km/h).[24]
August 31
- 00:00 UTC (7:00 p.m. CDT, August 30) at 31°18′N 92°36′W / 31.3°N 92.6°W / 31.3; -92.6 (Tropical Storm Harvey weakens to a tropical depression) – Tropical Storm Harvey weakens to a tropical depression about 110 mi (180 km) northeast of Cameron.[24]
- 06:00 UTC (2:00 a.m. AST) at 16°24′N 32°30′W / 16.4°N 32.5°W / 16.4; -32.5 (Tropical Storm Irma becomes a hurricane) – Tropical Storm Irma becomes a Category 1 hurricane about 460 mi (740 km) west of the Cabo Verde Islands.[29]
- 18:00 UTC (2:00 p.m. AST) at 17°06′N 34°12′W / 17.1°N 34.2°W / 17.1; -34.2 (Hurricane Irma intensifies to Category 2 strength) – Hurricane Irma intensifies to Category 2 strength, about 580 mi (930 km) west of the Cabo Verde Islands.[29]
September
September 1
- 00:00 UTC (8:00 p.m. AST, August 31) at 17°30′N 35°06′W / 17.5°N 35.1°W / 17.5; -35.1 (Hurricane Irma intensifies into a Category 3 hurricane) – Hurricane Irma intensifies into Category 3 hurricane, about 640 mi (1,030 km) west of the Cabo Verde Islands.[29]
- 06:00 UTC (1:00 a.m. CDT) at 34°54′N 88°12′W / 34.9°N 88.2°W / 34.9; -88.2 (Tropical Depression Harvey becomes extratropical) – Tropical Depression Harvey becomes extratropical over the Tennessee Valley, and subsequently dissipates.[24]
September 2
- 12:00 UTC (8:00 a.m. AST) at 18°54′N 42°36′W / 18.9°N 42.6°W / 18.9; -42.6 (Hurricane Irma weakens to Category 2) – Hurricane Irma weakens into Category 2 hurricane, about 1,260 mi (2,030 km) east of Barbuda.[29]
September 3
- 12:00 UTC (8:00 a.m. AST) at 17°54′N 47°54′W / 17.9°N 47.9°W / 17.9; -47.9 (Hurricane Irma re-strengthens to Category 3) – Hurricane Irma re-strengthens into Category 3 hurricane, about 915 mi (1,470 km) east of Barbuda.[29]
September 4
- 18:00 UTC (2:00 p.m. AST) at 16°42′N 53°54′W / 16.7°N 53.9°W / 16.7; -53.9 (Hurricane Irma intensifies into Category 4 strength) – Hurricane Irma intensifies into Category 4 hurricane, about 525 mi (845 km) east of Barbuda.[29]
September 5
- 06:00 UTC (2:00 a.m. AST) at 11°36′N 37°54′W / 11.6°N 37.9°W / 11.6; -37.9 (Eleventh tropical depression develops) – The eleventh tropical depression of the season develops from a tropical wave about 965 mi (1,550 km) west of the Cabo Verde Islands.[30]
- 12:00 UTC (8:00 a.m. AST) at 16°42′N 57°48′W / 16.7°N 57.8°W / 16.7; -57.8 (Hurricane Irma intensifies to Category 5) – Hurricane Irma intensifies to Category 5 strength, about 275 mi (440 km) east-southeast of Barbuda.[29]
- 12:00 UTC (8:00 a.m. AST) at 12°00′N 38°48′W / 12.0°N 38.8°W / 12.0; -38.8 (Tropical Storm Jose forms) – The eleventh tropical depression develops into Tropical Storm Jose, about 965 mi (1,555 km) west of the Cabo Verde Islands.[30]
- 12:00 UTC (7:00 a.m. CDT) at 22°12′N 97°12′W / 22.2°N 97.2°W / 22.2; -97.2 (Tropical Depression Thirteen develops) – Tropical Depression Thirteen develops from a tropical wave about 215 mi (350 km) north-northwest of Veracruz, Veracruz.[31]
September 6
- 05:45 UTC (1:45 a.m. AST) at 17°42′N 61°48′W / 17.7°N 61.8°W / 17.7; -61.8 (Hurricane Irma landfall on Barbuda) – Hurricane Irma makes landfall on Barbuda with sustained winds of 180 mph (285 km/h).[29]
- 06:00 UTC (2:00 a.m. AST) at 17°42′N 61°54′W / 17.7°N 61.9°W / 17.7; -61.9 (Hurricane Irma reaches peak intensity) – Hurricane Irma reaches its peak intensity with maximum sustained winds of 180 mph (285 km/h) and a minimum barometric pressure of 914 mbar (26.99 inHg), about 5 mi (10 km) west of Barbuda.[29]
- 06:00 UTC (1:00 a.m. CDT) at 22°12′N 96°24′W / 22.2°N 96.4°W / 22.2; -96.4 (Tropical Storm Katia forms) – Tropical Depression Thirteen intensifies into Tropical Storm Katia, about 205 mi (335 km) north of Veracruz.[31]
- 11:15 UTC (7:15 a.m. AST) at 18°06′N 63°06′W / 18.1°N 63.1°W / 18.1; -63.1 (Hurricane Irma landfall on St. Martin) – Hurricane Irma makes landfall on St. Martin with sustained winds of 180 mph (285 km/h).[29]
- 16:30 UTC (12:30 p.m. ADT) at 18°30′N 64°24′W / 18.5°N 64.4°W / 18.5; -64.4 (Hurricane Irma landfall on Virgin Gorda, British Virgin Islands) – Hurricane Irma makes landfall on Virgin Gorda, British Virgin Islands with sustained winds of 180 mph (285 km/h).[29]
- 18:00 UTC (2:00 a.m. AST) at 13°42′N 45°12′W / 13.7°N 45.2°W / 13.7; -45.2 – Tropical Storm Jose becomes a Category 1 hurricane, about 1,150 mi (1,850 km) east of the Leeward Islands.[30]
- 18:00 UTC (1:00 p.m. CDT) at 21°48′N 95°12′W / 21.8°N 95.2°W / 21.8; -95.2 (Tropical Storm Katia becomes a hurricane) – Tropical Storm Katia becomes a Category 1 hurricane, about 190 mi (305 km) north-northeast of Veracruz.[31]
September 7
- 12:00 UTC (8:00 a.m. AST) at 14°42′N 49°54′W / 14.7°N 49.9°W / 14.7; -49.9 (Hurricane Jose intensifies to Category 2) – Hurricane Jose intensifies into a Category 2 hurricane about 830 mi (1,335 km) east of the Leeward Islands.[30]
- 18:00 UTC (2:00 p.m. AST) at 15°06′N 51°30′W / 15.1°N 51.5°W / 15.1; -51.5 (Hurricane Jose intensifies to Category 3) – Hurricane Jose intensifies into a Category 3 hurricane about 720 mi (1,160 km) east of the Leeward Islands.[30]
September 8
- 05:00 UTC (1:00 a.m. EDT) at 21°30′N 73°00′W / 21.5°N 73.0°W / 21.5; -73.0 (Hurricane Irma weakens to Category 4 and makes landfall) – Hurricane Irma weakens to a Category 4 hurricane and makes landfall on Little Inagua, Bahamas, with sustained winds of 155 mph (250 km/h).[29]
- 06:00 UTC (2:00 a.m. AST) at 15°54′N 54°54′W / 15.9°N 54.9°W / 15.9; -54.9 (Hurricane Jose intensifies to Category 4) – Hurricane Jose intensifies into a Category 4 hurricane about 490 mi (785 km) east of the Leeward Islands.[30]
- 12:00 UTC (7:00 a.m. CDT) at 21°06′N 95°42′W / 21.1°N 95.7°W / 21.1; -95.7 (Hurricane Katia intensifies to Category 2) – Hurricane Katia intensifies into a Category 2 hurricane about 135 mi (215 km) north-northeast of Veracruz, Veracruz.[31]
- 18:00 UTC (2:00 p.m. EDT) at 22°00′N 76°00′W / 22.0°N 76.0°W / 22.0; -76.0 (Hurricane Irma re-intensifies to Category 5) – Hurricane Irma re-intensifies into a Category 5 hurricane about 125 mi (200 km) east of Cayo Romano, Cuba.[29]
- 18:00 UTC (1:00 p.m. CDT) at 21°06′N 96°12′W / 21.1°N 96.2°W / 21.1; -96.2 (Hurricane Katia attains its peak intensity) – Hurricane Katia attains its peak intensity with maximum sustained winds of 105 mph (165 km/h) and a minimum barometric pressure of 972 mbar (28.70 inHg), about 130 mi (210 km) north of Veracruz.[31]
September 9
- 00:00 UTC (8:00 p.m. AST, September 8) at 16°42′N 58°54′W / 16.7°N 58.9°W / 16.7; -58.9 (Hurricane Jose attains its peak intensity) – Hurricane Jose attains its peak intensity with maximum sustained winds of 155 mph (250 km/h) and a minimum barometric pressure of 938 mbar (27.70 inHg), about 220 mi (350 km) east of the Lesser Antilles.[30]
- 00:00 UTC (7:00 p.m. CDT, September 8) at 20°48′N 96°54′W / 20.8°N 96.9°W / 20.8; -96.9 (Hurricane Katia weakens to Category 1) – Hurricane Katia weakens to a Category 1 hurricane about 120 mi (195 km) north of Veracruz.[31]
- 03:00 UTC (11:00 p.m. EDT, September 8) at 22°18′N 77°54′W / 22.3°N 77.9°W / 22.3; -77.9 (Hurricane Irma makes landfall near Cayo Romano, Cuba) – Hurricane Irma makes landfall near Cayo Romano, Cuba, with winds of 165 mph (270 km/h).[29]
- 03:00 UTC (10:00 p.m. CDT September 8) at 20°36′N 97°06′W / 20.6°N 97.1°W / 20.6; -97.1 – Hurricane Katia makes landfall at Tecolutla, Veracruz, with winds of 75 mph (120 km/h).[31]
- 06:00 UTC (2:00 a.m. EDT) at 22°24′N 78°18′W / 22.4°N 78.3°W / 22.4; -78.3 (Hurricane Irma weakens to Category 4) – Hurricane Irma weakens to a Category 4 hurricane in the Jardines del Rey archipelago, about 90 mi (145 km) west of Cayo Romano.[29]
- 06:00 UTC (1:00 a.m. CDT) at 20°18′N 97°24′W / 20.3°N 97.4°W / 20.3; -97.4 – Hurricane Katia weakens to a tropical storm about 110 mi (175 km) northwest of Veracruz.[31]
- 12:00 UTC (8:00 a.m. EDT) at 22°42′N 79°18′W / 22.7°N 79.3°W / 22.7; -79.3 (Hurricane Irma weakens to Category 3) – Hurricane Irma weakens to a Category 3 hurricane about 45 mi (75 km) southeast of Isabela de Sagua, Cuba.[29]
- 12:00 UTC (7:00 a.m. CDT) at 20°06′N 97°42′W / 20.1°N 97.7°W / 20.1; -97.7 (Tropical Storm Katia weakens to a tropical depression) – Tropical Storm Katia weakens into a tropical depression about 115 mi (185 km) west-northwest of Veracruz, and later dissipates.[nb 8][31]
- 18:00 UTC (2:00 p.m. EDT) at 23°06′N 80°12′W / 23.1°N 80.2°W / 23.1; -80.2 (Hurricane Irma weakens to Category 2) – Hurricane Irma weakens to a Category 2 hurricane about 20 mi (30 km) northwest of Isabela de Sagua.[29]
September 10
- 00:00 UTC (8:00 p.m. EDT, September 9) at 23°24′N 80°54′W / 23.4°N 80.9°W / 23.4; -80.9 (Hurricane Irma re-intensifies to Category 3) – Hurricane Irma re-intensifies into a Category 3 hurricane about 100 mi (160 km) south-southeast of Key West, Florida.[29]
- 06:00 UTC (2:00 a.m. EDT) at 23°42′N 81°18′W / 23.7°N 81.3°W / 23.7; -81.3 (Hurricane Irma re-intensifies to Category 4) – Hurricane Irma re-intensifies into a Category 4 hurricane about 65 mi (100 km) south-southeast of Key West, Florida.[29]
- 13:00 UTC (9:00 a.m. EDT) at 24°42′N 81°30′W / 24.7°N 81.5°W / 24.7; -81.5 (Hurricane Irma makes landfall on Cudjoe Key, Florida) – Hurricane Irma makes landfall on Cudjoe Key, Florida, with winds of 130 mph (215 km/h).[29]
- 18:00 UTC (2:00 p.m. EDT) at 25°36′N 81°42′W / 25.6°N 81.7°W / 25.6; -81.7 (Hurricane Irma weakens to Category 3) – Hurricane Irma weakens to a Category 3 hurricane about 30 mi (45 km) south of Marco Island, Florida.[29]
- 18:00 UTC (2:00 p.m. AST) at 22°12′N 66°30′W / 22.2°N 66.5°W / 22.2; -66.5 (Hurricane Jose weakens to Category 3) – Hurricane Jose weakens to a Category 3 hurricane about 355 mi (570 km) northwest of the northern Leeward Islands.[30]
- 19:30 UTC (3:30 p.m. EDT) at 25°54′N 81°42′W / 25.9°N 81.7°W / 25.9; -81.7 (Hurricane Irma makes landfall near Marco Island, Florida) – Hurricane Irma makes its final landfall near Marco Island, with winds of 115 mph (185 km/h).[29]
September 11
- 00:00 UTC (8:00 p.m. EDT, September 10) at 26°48′N 81°42′W / 26.8°N 81.7°W / 26.8; -81.7 (Hurricane Irma weakens to Category 1) – Hurricane Irma weakens to a Category 1 hurricane inland, about 15 mi (25 km) east-northeast of Fort Myers, Florida.[29]
- 06:00 UTC (2:00 a.m. AST) at 24°18′N 68°36′W / 24.3°N 68.6°W / 24.3; -68.6 (Hurricane Jose weakens to Category 2) – Hurricane Jose weakens to a Category 2 hurricane about 550 mi (885 km) northwest of the northern Leeward Islands.[30]
- 12:00 UTC (8:00 a.m. EDT) at 29°36′N 82°42′W / 29.6°N 82.7°W / 29.6; -82.7 (Irma weakens to a tropical storm) – Hurricane Irma weakens to a tropical storm about 25 mi (35 km) west of Gainesville, Florida.[29]
- 18:00 UTC (2:00 p.m. AST) at 26°30′N 69°30′W / 26.5°N 69.5°W / 26.5; -69.5 (Hurricane Jose weakens to Category 1) – Hurricane Jose weakens to a Category 1 hurricane about 705 mi (1,130 km) northwest of the northern Leeward Islands.[30]
September 12
- 06:00 UTC (2:00 a.m. EDT) at 32°54′N 85°36′W / 32.9°N 85.6°W / 32.9; -85.6 (Tropical Storm Irma becomes a remnant low) – Tropical Storm Irma degenerates into a remnant low over central Alabama, and subsequently dissipates.[29]

September 14
- 18:00 UTC (2:00 p.m. AST) at 10°24′N 23°06′W / 10.4°N 23.1°W / 10.4; -23.1 (Tropical Depression Fourteen develops) – Tropical Depression Fourteen develops from a tropical wave about 305 mi (490 km) south of the Cabo Verde Islands.[33]
September 15
- 00:00 UTC (8:00 p.m. EDT, September 14) at 25°24′N 67°36′W / 25.4°N 67.6°W / 25.4; -67.6 (Hurricane Jose weakens to a tropical storm) – Hurricane Jose weakens to a tropical storm about 685 mi (1,100 km) northwest of the northern Leeward Islands.[30]
- 18:00 UTC (2:00 p.m. EDT) at 26°48′N 69°54′W / 26.8°N 69.9°W / 26.8; -69.9 (Tropical Storm Jose re-intensifies into a hurricane) – Tropical Storm Jose re-intensifies into a Category 1 hurricane about 845 mi (1,365 km) northwest of the northern Leeward Islands.[30]
September 16
- 12:00 UTC (8:00 a.m. AST) at 12°30′N 33°06′W / 12.5°N 33.1°W / 12.5; -33.1 (Tropical Depression Fourteen intensifies into Tropical Storm Lee) – Tropical Depression Fourteen intensifies into Tropical Storm Lee about 670 mi (1,080 km) southwest of the Cabo Verde Islands.[33]
- 12:00 UTC (8:00 a.m. AST) at 12°12′N 49°42′W / 12.2°N 49.7°W / 12.2; -49.7 (Tropical Depression Fifteen develops) – Tropical Depression Fifteen develops from a tropical wave about 665 mi (1,075 km) east of Barbados.[nb 9][35]
- 18:00 UTC (2:00 p.m. AST) at 12°12′N 51°42′W / 12.2°N 51.7°W / 12.2; -51.7 (Tropical Depression Fifteen intensifies into Tropical Storm Maria) – Tropical Depression Fifteen intensifies into Tropical Storm Maria about 530 mi (850 km) east of Barbados.[35]
September 17
- 12:00 UTC (8:00 a.m. EDT) at 30°30′N 71°54′W / 30.5°N 71.9°W / 30.5; -71.9 (Hurricane Jose attains secondary peak intensity) – Hurricane Jose attains a secondary peak intensity with sustained winds of 90 mph (150 km/h) and a barometric pressure of 967 mbar (28.56 inHg), about 495 mi (795 km) southeast of Virginia Beach, Virginia.[30]
- 12:00 UTC (8:00 a.m. AST) at 12°54′N 36°12′W / 12.9°N 36.2°W / 12.9; -36.2 (Tropical Storm Lee weakens to a tropical depression) – Tropical Storm Lee weakens to a tropical depression about 870 mi (1,395 km) west-southwest of the Cabo Verde Islands.[33]
- 18:00 UTC (2:00 p.m. AST) at 13°36′N 57°00′W / 13.6°N 57.0°W / 13.6; -57.0 (Tropical Storm Maria becomes a hurricane) – Tropical Storm Maria intensifies into a Category 1 hurricane, about 315 mi (505 km) east-southeast of Dominica.[35]
September 18
- 12:00 UTC (8:00 a.m. AST) at 14°30′N 59°42′W / 14.5°N 59.7°W / 14.5; -59.7 (Hurricane Maria intensifies to Category 3) – Hurricane Maria intensifies into a Category 3 hurricane, about 125 mi (200 km) east-southeast of Dominica.[35]
September 19
- 00:00 UTC (8:00 p.m. AST, September 18) at 15°18′N 61°06′W / 15.3°N 61.1°W / 15.3; -61.1 (Hurricane Maria intensifies to Category 5) – Hurricane Maria intensifies into a Category 5 hurricane, about 15 mi (25 km) east-southeast of Dominica.[35]
- 01:15 UTC (9:15 p.m. AST, September 18) at 15°24′N 61°18′W / 15.4°N 61.3°W / 15.4; -61.3 (Hurricane Maria makes landfall) – Hurricane Maria makes landfall in Dominica with maximum winds near 165 mph (270 km/h).[35]
- 06:00 UTC (2:00 a.m. AST) at 15°42′N 61°54′W / 15.7°N 61.9°W / 15.7; -61.9 (Hurricane Maria weakens to Category 4) – Hurricane Maria weakens to Category 4 strength, about 45 mi (70 km) west-northwest of Dominica.[35]
- 12:00 UTC (8:00 a.m. EDT) at 36°18′N 71°42′W / 36.3°N 71.7°W / 36.3; -71.7 (Hurricane Jose weakens to a tropical storm) – Hurricane Jose weakens again to a tropical storm, about 240 mi (390 km) east of Virginia Beach.[30]
- 12:00 UTC (8:00 a.m. AST) at 16°06′N 62°42′W / 16.1°N 62.7°W / 16.1; -62.7 (Hurricane Maria re-strengthens to Category 5) – Hurricane Maria re-strengthens into a Category 5 hurricane about 175 mi (285 km) southeast of Saint Croix.[35]
- 18:00 UTC (2:00 p.m. AST) at 16°48′N 44°24′W / 16.8°N 44.4°W / 16.8; -44.4 – Tropical Depression Lee re-intensifies into a tropical storm about 1,105 mi (1,780 km) east of the northern Leeward Islands.[33]
September 20
- 03:00 UTC (11:00 p.m. AST, September 19) at 17°18′N 64°42′W / 17.3°N 64.7°W / 17.3; -64.7 (Hurricane Maria attains its peak intensity) – Hurricane Maria attains its peak intensity with maximum sustained winds of 175 mph (280 km/h) and a minimum barometric pressure of 908 mbar (26.81 inHg), about 30 mi (45 km) south of Saint Croix.[35]
- 10:15 UTC (6:15 a.m. AST) at 18°00′N 65°54′W / 18.0°N 65.9°W / 18.0; -65.9 (Hurricane Maria weakens to Category 4 and makes landfall) – Hurricane Maria weakens to a Category 4 hurricane and makes landfall near Yabucoa, Puerto Rico with maximum winds near 155 mph (250 km/h).[35]
- 12:00 UTC (8:00 a.m. AST) at 20°24′N 44°06′W / 20.4°N 44.1°W / 20.4; -44.1 (Tropical Storm Lee opens up into a trough) – Tropical Storm Lee degenerates to a trough of low pressure about 1,150 mi (1,850 km) east of the northern Leeward Islands.[33]
- 18:00 UTC (2:00 p.m. AST) at 18°36′N 67°00′W / 18.6°N 67.0°W / 18.6; -67.0 (Hurricane Maria moves offshore of Puerto Rico) – Hurricane Maria emerges off the northwest coast of Puerto Rico at Category 2 strength, about 15 mi (24 km) west of Arecibo, Puerto Rico.[35][36]
September 21
- 06:00 UTC (2:00 a.m. AST) at 19°24′N 68°12′W / 19.4°N 68.2°W / 19.4; -68.2 (Hurricane Maria re-strengthens to Category 3) – Hurricane Maria re-strengthens into a Category 3 hurricane about 55 mi (89 km) northeast of Punta Cana, Dominican Republic.[35][36]
September 22
- 00:00 UTC (8:00 p.m. AST, September 21) at 20°48′N 70°00′W / 20.8°N 70.0°W / 20.8; -70.0 (Hurricane Maria attains its secondary peak wind speed) – Hurricane Maria reaches a secondary peak wind speed of near 125 mph (205 km/h), about 70 mi (110 km) southeast of Grand Turk Island.[35]
- 12:00 UTC (8:00 a.m. AST) at 30°00′N 48°54′W / 30.0°N 48.9°W / 30.0; -48.9 (Remnants of Lee regenerate into a tropical depression) – Remnants of Lee regenerate into a tropical depression about 950 mi (1,530 km) east-southeast of Bermuda.[33]
- 18:00 UTC (2:00 p.m. EDT) at 39°42′N 69°06′W / 39.7°N 69.1°W / 39.7; -69.1 (Jose becomes post-tropical) – Tropical Storm Jose becomes a post-tropical cyclone about 120 mi (195 km) south-southeast of Nantucket, Massachusetts, and subsequently dissipates.[30]
September 23
- 00:00 UTC (8:00 p.m. AST, September 22) at 31°06′N 49°12′W / 31.1°N 49.2°W / 31.1; -49.2 – Tropical Depression Lee re-intensifies into a tropical storm about 915 mi (1,470 km) east of Bermuda.[33]
September 24
- 06:00 UTC (2:00 a.m. AST) at 31°42′N 50°12′W / 31.7°N 50.2°W / 31.7; -50.2 (Tropical Storm Lee intensifies into a hurricane) – Tropical Storm Lee intensifies into a Category 1 hurricane about 850 mi (1,370 km) east of Bermuda.[33]
- 06:00 UTC 2:00 a.m. EDT) at 27°30′N 72°36′W / 27.5°N 72.6°W / 27.5; -72.6 (Hurricane Maria weakens to Category 2) – Hurricane Maria weakens to a Category 2 hurricane, about 560 mi (900 km) south-southeast of Cape Hatteras, North Carolina.[35]
September 25
- 00:00 UTC (8:00 p.m. AST, September 24) at 31°12′N 49°36′W / 31.2°N 49.6°W / 31.2; -49.6 (Hurricane Lee intensifies to Category 2) – Hurricane Lee intensifies into a Category 2 hurricane, about 890 mi (1,435 km) east of Bermuda.[33]
- 06:00 UTC (2:00 a.m. AST) at 31°00′N 49°30′W / 31.0°N 49.5°W / 31.0; -49.5 (Hurricane Lee weakens to Category 1) – Hurricane Lee weakens to a Category 1 hurricane, about 900 mi (1,445 km) east of Bermuda.[33]
- 06:00 UTC (2:00 a.m. EDT) at 30°18′N 72°54′W / 30.3°N 72.9°W / 30.3; -72.9 (Hurricane Maria weakens to Category 1) – Hurricane Maria weakens to a Category 1 hurricane, about 370 mi (595 km) south-southeast of Cape Hatteras, North Carolina.[35]
September 26
- 06:00 UTC (2:00 a.m. AST) at 30°06′N 52°00′W / 30.1°N 52.0°W / 30.1; -52.0 (Hurricane Lee re-intensifies to Category 2) – Hurricane Lee re-intensifies into a Category 2 hurricane about 765 mi (1,230 km) east-southeast of Bermuda.[33]
September 27
- 12:00 UTC (8:00 a.m. AST) at 30°18′N 56°36′W / 30.3°N 56.6°W / 30.3; -56.6 (Hurricane Lee intensifies to Category 3) – Hurricane Lee intensifies into a Category 3 hurricane, about 500 mi (805 km) east-southeast of Bermuda.[33]
- 18:00 UTC (2:00 p.m. AST) at 30°48′N 57°00′W / 30.8°N 57.0°W / 30.8; -57.0 (Hurricane Lee attains its peak intensity) – Hurricane Lee attains its peak intensity with maximum sustained winds of 115 mph (185 km/h) and a minimum barometric pressure of 962 mbar (28.41 inHg), about 465 mi (750 km) east of Bermuda.[33]
September 28
- 00:00 UTC (8:00 p.m. AST, September 27) at 31°24′N 57°12′W / 31.4°N 57.2°W / 31.4; -57.2 (Hurricane Lee weakens to Category 2) – Hurricane Lee weakens to a Category 2 hurricane about 445 mi (715 km) east of Bermuda.[33]
- 06:00 UTC (2:00 a.m. EDT) at 36°42′N 71°18′W / 36.7°N 71.3°W / 36.7; -71.3 (Hurricane Maria weakens to a tropical storm) – Hurricane Maria weakens to a tropical storm about 255 mi (415 km) east-northeast of Cape Hatteras.[35]
- 18:00 UTC (2:00 p.m. AST) at 34°18′N 56°36′W / 34.3°N 56.6°W / 34.3; -56.6 (Hurricane Lee weakens to Category 1) – Hurricane Lee weakens to a Category 1 hurricane about 485 mi (780 km) east-northeast of Bermuda.[33]
September 29
- 18:00 UTC (2:00 p.m. AST) at 41°00′N 48°12′W / 41.0°N 48.2°W / 41.0; -48.2 (Hurricane Lee weakens to a tropical storm) – Hurricane Lee weakens to a tropical storm about 1,085 mi (1,750 km) northeast of Bermuda.[33]
September 30
- 06:00 UTC (2:00 a.m. AST) at 45°48′N 38°54′W / 45.8°N 38.9°W / 45.8; -38.9 (Tropical Storm Lee becomes post-tropical) – Tropical Storm Lee becomes a post-tropical low about 460 mi (740 km) northwest of the Azores, and later opens up into a trough.[33]
- 18:00 UTC (2:00 p.m. AST) at 41°12′N 45°36′W / 41.2°N 45.6°W / 41.2; -45.6 (Tropical Storm Maria becomes extratropical) – Tropical Storm Maria becomes extratropical about 535 mi (860 km) southeast of Cape Race, Newfoundland, and subsequently dissipates.[35]
October
October 4
- 12:00 UTC (8:00 a.m. EDT) at 12°00′N 81°48′W / 12.0°N 81.8°W / 12.0; -81.8 (Tropical Depression Sixteen forms) – Tropical Depression Sixteen forms from an area of low pressure approximately 40 mi (65 km) south of San Andres Island.[37]
October 5
- 06:00 UTC (02:00 a.m. EDT) at 13°06′N 83°06′W / 13.1°N 83.1°W / 13.1; -83.1 (Tropical Depression Sixteen becomes Tropical Storm Nate) – Tropical Depression Sixteen intensifies into Tropical Storm Nate about 100 mi (155 km) west-northwest of San Andres Island.[37]
- 12:00 UTC (08:00 a.m. EDT) at 13°54′N 83°30′W / 13.9°N 83.5°W / 13.9; -83.5 (Tropical Storm Nate makes landfall) – Tropical Storm Nate makes landfall on the coast of northeastern Nicaragua with winds of 40 mph (65 km/h).[37]
October 7
- 06:0 UTC (1:00 a.m. CDT) at 23°30′N 86°30′W / 23.5°N 86.5°W / 23.5; -86.5 (Tropical Storm Nate becomes a hurricane) – Tropical Storm Nate intensifies into a Category 1 hurricane over the southeastern Gulf of Mexico, about 420 mi (680 km) south-southeast of the mouth of the Mississippi River.[37]
- 18:00 UTC (1:00 p.m. CDT) at 27°36′N 88°54′W / 27.6°N 88.9°W / 27.6; -88.9 (Hurricane Nate attains its peak intensity) – Hurricane Nate attains its peak intensity with maximum sustained winds of 90 mph (150 km/h) and a minimum barometric pressure of 981 mbar (28.97 inHg), about 105 mi (170 km) south of the mouth of the Mississippi River.[37]
October 8
- 00:00 UTC (7:00 p.m. CDT, October 7) at 29°06′N 89°12′W / 29.1°N 89.2°W / 29.1; -89.2 (Hurricane Nate makes Mississippi River Delta landfall) – Hurricane Nate makes landfall at the mouth of the Mississippi River with maximum winds of 85 mph (140 km/h).[37]
- 05:20 UTC (12:20 a.m. CDT) at 30°24′N 89°00′W / 30.4°N 89.0°W / 30.4; -89.0 (Hurricane Nate makes final landfall) – Hurricane Nate makes its final landfall about 5 mi (10 km) west of Biloxi, Mississippi with maximum winds of 75 mph (120 km/h).[37]
- 06:00 UTC (1:00 a.m. CDT) at 30°30′N 88°54′W / 30.5°N 88.9°W / 30.5; -88.9 (Hurricane Nate weakens into tropical storm) – Hurricane Nate weakens to a tropical storm inland, about 5 mi (10 km) north of Biloxi.[37]
- 18:00 UTC (1:00 p.m. CDT) at 34°06′N 87°06′W / 34.1°N 87.1°W / 34.1; -87.1 (Tropical Storm Nate becomes a tropical depression) – Tropical Storm Nate weakens into a tropical depression over northern Alabama.[37]
October 9
- 00:00 UTC (8:00 p.m. EDT, October 8) at 36°12′N 85°42′W / 36.2°N 85.7°W / 36.2; -85.7 (Tropical Depression Nate become a remnant low) – Tropical Depression Nate degenerates to a remnant low over central Tennessee.[37]
- 06:00 UTC (2:00 a.m. EDT) at 39°06′N 83°24′W / 39.1°N 83.4°W / 39.1; -83.4 (Remnants of Nate become extratropical) – The remnants of Nate become extratropical over southern Ohio, and subsequently dissipate.[37]
- 06:00 UTC (2:00 a.m. AST) at 30°54′N 40°00′W / 30.9°N 40.0°W / 30.9; -40.0 (Tropical Storm Ophelia develops) – Tropical Storm Ophelia develops from an area of low pressure about 875 mi (1,410 km) west-southwest of the Azores.[38]

October 11
- 18:00 UTC (2:00 p.m. AST) at 29°48′N 36°12′W / 29.8°N 36.2°W / 29.8; -36.2 (Tropical Storm Ophelia becomes a hurricane) – Tropical Storm Ophelia intensifies into a Category 1 hurricane about 760 mi (1,220 km) southwest of the Azores.[38]
October 12
- 18:00 UTC (2:00 p.m. AST) at 30°30′N 35°36′W / 30.5°N 35.6°W / 30.5; -35.6 (Hurricane Ophelia intensifies to Category 2) – Hurricane Ophelia intensifies into Category 2 hurricane, about 715 mi (1,150 km) southwest of the Azores.[38]
October 13
- 00:00 UTC (8:00 p.m. AST, October 12) at 30°30′N 35°06′W / 30.5°N 35.1°W / 30.5; -35.1 (Ophelia reaches its initial peak windspeed) – Hurricane Ophelia reaches an initial peak windspeed of 105 mph (165 km/h), about 655 mi (1,055 km) southwest of the Azores.[38]
- 12:00 UTC (8:00 a.m. AST) at 31°24′N 33°24′W / 31.4°N 33.4°W / 31.4; -33.4 (Hurricane Ophelia weakens to Category 1) – Hurricane Ophelia weakens to a Category 1 hurricane about 580 mi (935 km) southwest of the Azores.[38]
October 14
- 00:00 UTC (8:00 p.m. AST, October 13) at 32°36′N 31°30′W / 32.6°N 31.5°W / 32.6; -31.5 (Hurricane Ophelia re-strengthens to Category 2) – Hurricane Ophelia re-strengthens into a Category 2 hurricane about 460 mi (740 km) southwest of the Azores.[38]
- 12:00 UTC (8:00 a.m. AST) at 34°12′N 27°42′W / 34.2°N 27.7°W / 34.2; -27.7 (Hurricane Ophelia intensifies to Category 3) – Hurricane Ophelia intensifies into Category 3 hurricane and simultaneously attains its peak intensity with maximum sustained winds of 115 mph (185 km/h) and a minimum pressure of 959 mbar (28.32 inHg) about 310 mi (500 km) south of the Azores.[38]
October 15
- 00:00 UTC (8:00 p.m. AST, October 14) at 36°24′N 22°36′W / 36.4°N 22.6°W / 36.4; -22.6 (Hurricane Ophelia weakens to Category 2) – Hurricane Ophelia weakens to a Category 2 hurricane about 345 mi (550 km) southeast of the Azores.[38]
- 18:00 UTC (2:00 p.m. AST) at 43°06′N 14°18′W / 43.1°N 14.3°W / 43.1; -14.3 (Hurricane Ophelia weakens to Category 1) – Hurricane Ophelia weakens to a Category 1 hurricane about 625 mi (1,010 km) southwest of Mizen Head, Ireland.[38]
October 16
- 00:00 UTC (8:00 p.m. AST, October 15) at 47°36′N 13°24′W / 47.6°N 13.4°W / 47.6; -13.4 (Hurricane Ophelia becomes extratropical) – Hurricane Ophelia becomes an extratropical cyclone about 310 mi (500 km) southwest of Mizen Head, and subsequently dissipates.[nb 10][38]
October 28
- 12:00 UTC (8:00 a.m. EDT) at 20°06′N 83°30′W / 20.1°N 83.5°W / 20.1; -83.5 (Tropical Depression Eighteen forms) – Tropical Depression Eighteen forms from a tropical wave about 100 mi (155 km) south-southwest of Isle of Youth.[nb 11][40]
- 18:00 UTC (2:00 p.m. EDT) at 21°18′N 82°24′W / 21.3°N 82.4°W / 21.3; -82.4 (Tropical Depression Eighteen becomes Tropical Storm Philippe) – Tropical Depression Eighteen intensifies into Tropical Storm Philippe and simultaneously attains its peak intensity with winds of 40 mph (65 km/h) and a minimum pressure of 1,000 mbar (29.53 inHg), about 35 mi (55 km) east-southeast of the Isle of Youth.[40]
- 22:00 UTC (6:00 p.m. EDT) at 22°12′N 81°36′W / 22.2°N 81.6°W / 22.2; -81.6 (Tropical Storm Philippe makes landfall) – Tropical Storm Philippe makes landfall along southern coast of the Zapata Peninsula of Cuba, about 30 mi (45 km) west of the Bay of Pigs, with winds of 40 mph (65 km/h).[40]
October 29
- 00:00 UTC (8:00 p.m. EDT October 28) at 22°42′N 81°12′W / 22.7°N 81.2°W / 22.7; -81.2 (Tropical Storm Philippe weakens to a tropical depression) – Tropical Storm Philippe weakens to a tropical depression inland over west-central Cuba, and later dissipates.[nb 12][40]

November
November 5
- 18:00 UTC (2:00 p.m. AST) at 29°12′N 51°42′W / 29.2°N 51.7°W / 29.2; -51.7 (Tropical Depression Nineteen develops) – Tropical Depression Nineteen develops from the interaction between a tropical wave and a large mid- to upper-level trough about 805 mi (1,295 km) east-southeast of Bermuda.[41]
November 7
- 00:00 UTC (8:00 p.m. AST November 6) at 30°00′N 50°00′W / 30.0°N 50.0°W / 30.0; -50.0 (Tropical Depression Nineteen intensifies into Tropical Storm Rina) – Tropical Depression Nineteen intensifies into Tropical Storm Rina about 900 mi (1,445 km) east of Bermuda.[41]
November 8
- 06:00 UTC (2:00 a.m. AST) at 36°24′N 48°42′W / 36.4°N 48.7°W / 36.4; -48.7 (Tropical Storm Rina attains peak sustained winds) – Tropical Storm Rina attains peak sustained winds of 60 mph (95 km/h) about 750 mi (1,205 km) south-southeast of Cape Race, Newfoundland.[41]
November 9
- 00:00 UTC (8:00 p.m. AST, November 8) at 41°48′N 48°48′W / 41.8°N 48.8°W / 41.8; -48.8 (Tropical Storm Rina attains minimum barometric pressure) – Tropical Storm Rina attains a minimum barometric pressure of 991 mbar (29.26 inHg) about 400 mi (645 km) south-southeast of Cape Race.[41]
- 06:00 UTC (2:00 a.m. AST) at 43°36′N 48°00′W / 43.6°N 48.0°W / 43.6; -48.0 – Tropical Storm Rina becomes a post-tropical cyclone about 345 mi (555 km) southeast of Cape Race, Newfoundland, and later merges with a complex extratropical low pressure area.[nb 13][41]
November 30
- The 2017 Atlantic hurricane season officially ends.[3]
See also
 Tropical cyclones portal

Notes
- ^ An average Atlantic hurricane season, as defined by the National Oceanic and Atmospheric Administration, has 12 tropical storms, six hurricanes and two major hurricanes.[1]
- ^ The National Hurricane Center initiated advisories on this system at 21:00 UTC (5:00 p.m. AST) on June 18, designating it Potential Tropical Cyclone Two.[9]
- ^ The remnants of Bret moved westward across Central America and into the Eastern Pacific Ocean, where they contributed to the formation of Hurricane Dora on June 24.[11]
- ^ The National Hurricane Center initiated advisories on this system at 21:00 UTC (4:00 p.m. CDT) on June 19, designating it Potential Tropical Cyclone Three.[12]
- ^ The National Hurricane Center initiated advisories on this system at 21:00 UTC (5:00 p.m. EDT) on August 6, designating it Potential Tropical Cyclone Seven.[18]
- ^ The remnants of Franklin moved westward across Mexico and into the Eastern Pacific Ocean, where they contributed to the formation of Tropical Storm Jova on August 11.[20]
- ^ The National Hurricane Center initiated advisories on this system at 15:00 UTC (11:00 a.m. AST) on August 17, designating it Potential Tropical Cyclone Nine.[23]
- ^ The remnants of Katia moved westward across Mexico and into the Eastern Pacific Ocean, where they contributed to the formation of Hurricane Otis on September 11.[32]
- ^ The National Hurricane Center initiated advisories on this system at 15:00 UTC (11:00 a.m. AST) on September 16, designating it Potential Tropical Cyclone Fifteen.[34]
- ^ Extratropical Ophelia moved across western Ireland, northern Scotland, the North Sea, and southern Norway as a European windstorm.[38]
- ^ The National Hurricane Center initiated advisories on this system at 21:00 UTC (5:00 p.m. EDT) on October 27, designating it Potential Tropical Cyclone Eighteen.[39]
- ^ Operationally, Philippe was assessed as crossing the Florida Keys and exiting into the western Atlantic, but post-season analysis showed that this was a non-tropical area of low pressure that was interacting with Philippe.[40]
- ^ This extratropical system, as Cyclone Numa, moved across Europe and later acquired subtropical characteristics, becoming a rare "medicane".[42]
References
- ^ "Background Information: North Atlantic Hurricane Season". College Park, Maryland: NOAA Climate Prediction Center. Retrieved July 11, 2020.
- ^ a b Vaccaro, Chris (November 30, 2017). "Extremely active 2017 Atlantic hurricane season finally ends". Silver Spring, Maryland: National Oceanic and Atmospheric Administration. Retrieved July 11, 2020.
- ^ a b c Dorst, Neal (June 1, 2018). "Hurricane Season Information". Frequently Asked Questions About Hurricanes. Miami, Florida: NOAA Atlantic Oceanographic and Meteorological Laboratory. Retrieved June 29, 2020.
- ^ Donegan, Brian (September 30, 2017). "September 2017 Was the Most Active Month on Record for Atlantic Hurricanes". weather.com. The Weather Channel. Retrieved July 11, 2010.
- ^ Allen, Greg (April 12, 2018). "Harvey, Irma, Maria And Nate Are Finished As Hurricane Names". NPR. Retrieved July 17, 2021.
- ^ "Understanding the Date/Time Stamps". Miami, Florida: NOAA National Hurricane Center. Retrieved July 10, 2020.
- ^ "Update on National Hurricane Center Products and Services for 2020" (PDF). Miami, Florida: National Hurricane Center. April 20, 2020. Retrieved May 17, 2020.
- ^ a b c d e Cangialosi, John P. (July 5, 2017). Tropical Cyclone Report: Tropical Storm Arlene (PDF) (Report). Miami, Florida: National Hurricane Center. Retrieved July 20, 2017.
- ^ Brennan, Michael J. (June 18, 2017). Potential Tropical Cyclone Two Advisory Number 1 (Report). Miami, Florida: National Hurricane Center. Retrieved August 27, 2022.
- ^ a b c Brennan, Michael J. (March 5, 2018). Tropical Cyclone Report: Tropical Storm Bret (PDF) (Report). Miami, Florida: National Hurricane Center. Retrieved March 10, 2018.
- ^ Berg, Robbie J. (November 20, 2017). Tropical Cyclone Report: Hurricane Dora (PDF) (Report). Miami, Florida: National Hurricane Center. Retrieved July 8, 2021.
- ^ Brennan, Michael J. (June 19, 2017). Potential Tropical Cyclone Three Advisory Number 1 (Report). Miami, Florida: National Hurricane Center. Retrieved August 27, 2022.
- ^ a b c d e f Berg, Robbie J. (January 26, 2018). Tropical Cyclone Report: Tropical Storm Cindy (PDF) (Report). Miami, Florida: National Hurricane Center. Retrieved March 8, 2018.
- ^ a b c Avila, Lixion A. (October 20, 2017). Tropical Cyclone Report: Tropical Depression Four (PDF) (Report). Miami, Florida: National Hurricane Center. Retrieved March 10, 2018.
- ^ a b c d Blake, Eric S. (December 19, 2017). Tropical Cyclone Report: Tropical Storm Don (PDF) (Report). Miami, Florida: National Hurricane Center. Retrieved March 10, 2018.
- ^ a b c d e Pasch, Richard J.; Latto, Andrew S.; Cangialosi, John P. (February 14, 2019). Tropical Cyclone Report: Tropical Storm Emily (PDF) (Report). Miami, Florida: National Hurricane Center. Retrieved July 3, 2021.
- ^ Combs, Felicia (August 2, 2017). "Emily becomes post-tropical". West Palm Beach, Florida: WPTV-TV. Retrieved July 3, 2021.
- ^ Pasch, Richard J. (August 6, 2017). Potential Tropical Cyclone Seven Advisory Number 1 (Report). Miami, Florida: National Hurricane Center. Retrieved August 27, 2022.
- ^ a b c d e f g h Beven, John L. (March 12, 2018). Tropical Cyclone Report: Hurricane Franklin (PDF) (Report). Miami, Florida: National Hurricane Center. Retrieved July 3, 2021.
- ^ Cangialosi, John P. (November 16, 2017). Tropical Cyclone Report: Tropical Storm Jova (PDF) (Report). Miami, Florida: National Hurricane Center. Retrieved July 8, 2021.
- ^ Pasch, Richard J. (August 10, 2017). Tropical Storm Franklin Intermediate Advisory Number 15A (Report). Miami, Florida: National Hurricane Center. Retrieved July 3, 2021.
- ^ a b c d e f g h Stewart, Stacy R. (March 17, 2018). Tropical Cyclone Report: Hurricane Gert (PDF) (Report). Miami, Florida: National Hurricane Center. Retrieved July 3, 2021.
- ^ Beven, Jack L. (August 17, 2017). Potential Tropical Cyclone Nine Advisory Number 1 (Report). Miami, Florida: National Hurricane Center. Retrieved August 27, 2022.
- ^ a b c d e f g h i j k l m n o p q r s t u Zelinsky, David A. (May 9, 2018). Tropical Cyclone Report: Hurricane Harvey (PDF) (Report). Miami, Florida: National Hurricane Center. Retrieved July 3, 2021.
- ^ Berg, Robbie J. (August 24, 2017). Hurricane Harvey Special Advisory Number 17...CORRECTED (Report). Miami, Florida: National Hurricane Center. Retrieved July 5, 2021.
- ^ Avila, Lixion A. (August 25, 2017). Hurricane Harvey Intermediate Advisory Number 19A (Report). Miami, Florida: National Hurricane Center. Retrieved July 5, 2021.
- ^ Berg, Robbie J. (August 25, 2017). Hurricane Harvey Intermediate Advisory Number 21A (Report). Miami, Florida: National Hurricane Center. Retrieved July 5, 2021.
- ^ Beven, John L. (August 25, 2017). Hurricane Harvey Intermediate Advisory Number 22A (Report). Miami, Florida: National Hurricane Center. Retrieved July 5, 2021.
- ^ a b c d e f g h i j k l m n o p q r s t u v w x y z aa Cangialosi, John P.; Latta, Andrew S.; Berg, Robbie J. (March 9, 2018). Tropical Cyclone Report: Hurricane Irma (PDF) (Report). Miami, Florida: National Hurricane Center. Retrieved March 12, 2018.
- ^ a b c d e f g h i j k l m n o Berg, Robbie J. (February 20, 2018). Tropical Cyclone Report: Hurricane Jose (PDF) (Report). Miami, Florida: National Hurricane Center. Retrieved March 10, 2018.
- ^ a b c d e f g h i Avila, Lixion A. (November 28, 2017). Tropical Cyclone Report: Hurricane Katia (PDF) (Report). Miami, Florida: National Hurricane Center. Retrieved March 12, 2018.
- ^ Blake, Eric S. (January 9, 2018). Tropical Cyclone Report: Hurricane Otis (PDF) (Report). Miami, Florida: National Hurricane Center. Retrieved July 8, 2021.
- ^ a b c d e f g h i j k l m n o p q Blake, Eric S. (February 13, 2018). Tropical Cyclone Report: Hurricane Lee (PDF) (Report). Miami, Florida: National Hurricane Center. Retrieved March 11, 2018.
- ^ Cangialosi, John P. (August 16, 2017). Potential Tropical Cyclone Fifteen Advisory Number 1 (Report). Miami, Florida: National Hurricane Center. Retrieved August 27, 2022.
- ^ a b c d e f g h i j k l m n o p q Pasch, Richard J.; Penny, Andrew B.; Berg, Robbie (February 14, 2019). Tropical Cyclone Report: Hurricane Maria (PDF) (Report). Miami, Florida: National Hurricane Center. Retrieved July 7, 2021.
- ^ a b "The Latest: Maria regains its major hurricane status". AP News. Associated Press. September 21, 2017. Retrieved July 6, 2021.
- ^ a b c d e f g h i j k Beven, John L.; Berg, Robbie Berg (April 5, 2018). Tropical Cyclone Report: Hurricane Nate (PDF) (Report). Miami, Florida: National Hurricane Center. Retrieved July 8, 2021.
- ^ a b c d e f g h i j k Stewart, Stacy R. (March 27, 2018). Tropical Cyclone Report: Hurricane Ophelia (PDF) (Report). Miami, Florida: National Hurricane Center. Retrieved July 8, 2021.
- ^ Brennen, Michael J. (October 27, 2017). Potential Tropical Cyclone Eighteen Advisory Number 1 (Report). Miami, Florida: National Hurricane Center. Retrieved August 27, 2022.
- ^ a b c d e Brown, Daniel P. (January 31, 2018). Tropical Cyclone Report: Tropical Storm Philippe (PDF) (Report). Miami, Florida: National Hurricane Center. Retrieved March 9, 2018.
- ^ a b c d e Cangialosi, John P. (January 9, 2018). Tropical Cyclone Report: Tropical Storm Rina (PDF) (Report). Miami, Florida: National Hurricane Center. Retrieved March 8, 2018.
- ^ Sullivan, Brian K. (November 27, 2017). "Storm That Unleashed Deadly Floods in Greece Was a Rare 'Medicane'". New York, New York: Bloomberg. Retrieved September 26, 2021.
External links
Wikimedia Commons has media related to 2017 Atlantic hurricane season.
- 2017 Tropical Cyclone Advisory Archive, National Hurricane Center and Central Pacific Hurricane Center
- Hurricanes and Tropical Storms – Annual 2017, National Centers for Environmental Information


